Using EmbedPress, you can analyze embedded analytics for every piece of content you embed, whether it’s a PDF, video, audio, Doc, polls, or more, right inside your WordPress dashboard.
With a clean, real-time overview, you can see Total Embeds, Views, Unique Views, Clicks, and Impressions at a glance. Additionally, it provides breakdowns of device and browser usage, viewer locations, UTM/traffic sources, and per-embed performance metrics (including CTR and top content). You can also filter by date range and export reports to share results with your team.
In this guide, we will walk you through enabling tracking, reading each metric and chart, and exporting reports so you can confidently analyze embedded analytics in WordPress with EmbedPress for your site.
[Note: EmbedPress Analytics is a premium feature. So, you need to install and activate the EmbedPress Pro plugin along with the free version to use this.]
Where to Find Embedded Content Analytics Overview? #
Log in to your WordPress website. From the dashboard, you can find the embedded analytics under EmbedPress from the left sidebar titled ‘Analytics’. Click it to open the analytics dashboard.

How to Analyze Embedded Analytics in EmbedPress? #
Now that you have opened the EmbedPress Analytics dashboard, you can find your embedded content insights and viewers’ behaviours on embeds here.
Step 1: Enable Analytics Tracking #
From the EmbedPress Analytics dashboard, toggle on to enable the ‘Analytics Tracking’ button located at the top and vice versa. Numbers populate from the moment tracking is enabled and it will analyze embedded analytics for every PDF, video, audio, Google item, and more you publish throughout your website using EmbedPress.
Step 2: Check EmbedPress Analytics Insights #
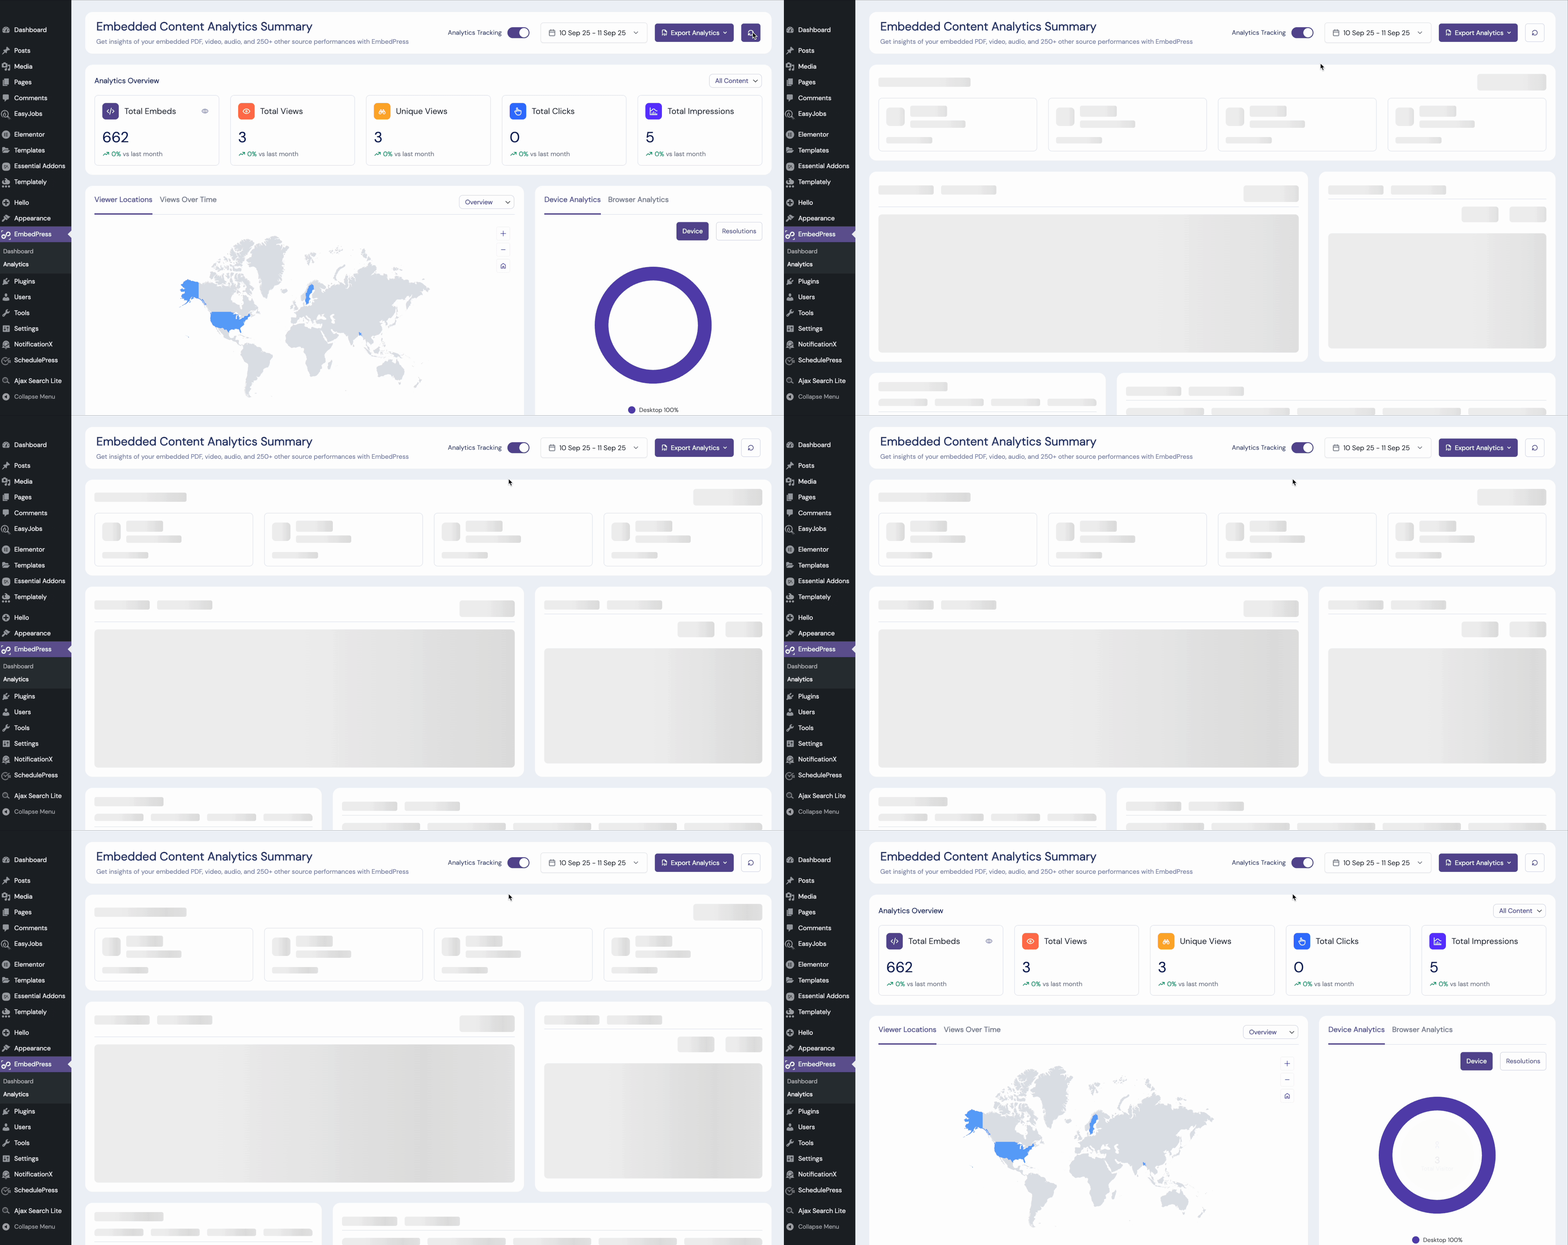
At the top of the summary screen, you will see KPI cards for Total Embeds, Total Views, Unique Views, Total Clicks, and Total Impressions. If views climb while unique views remain flat, you are likely seeing repeat engagement from a smaller audience. If impressions are high but views and clicks are low, the embeds are being checked, but the audiences are not performing any actions.

Embedded Content Detailed Analytics #
Select Embedded Content Detailed Analytics by clicking on the eye icon on the total embeds tab to open an in-depth panel. Counters at the top summarize Total Embeds overall and break them down by Elementor, Gutenberg, and Shortcode.
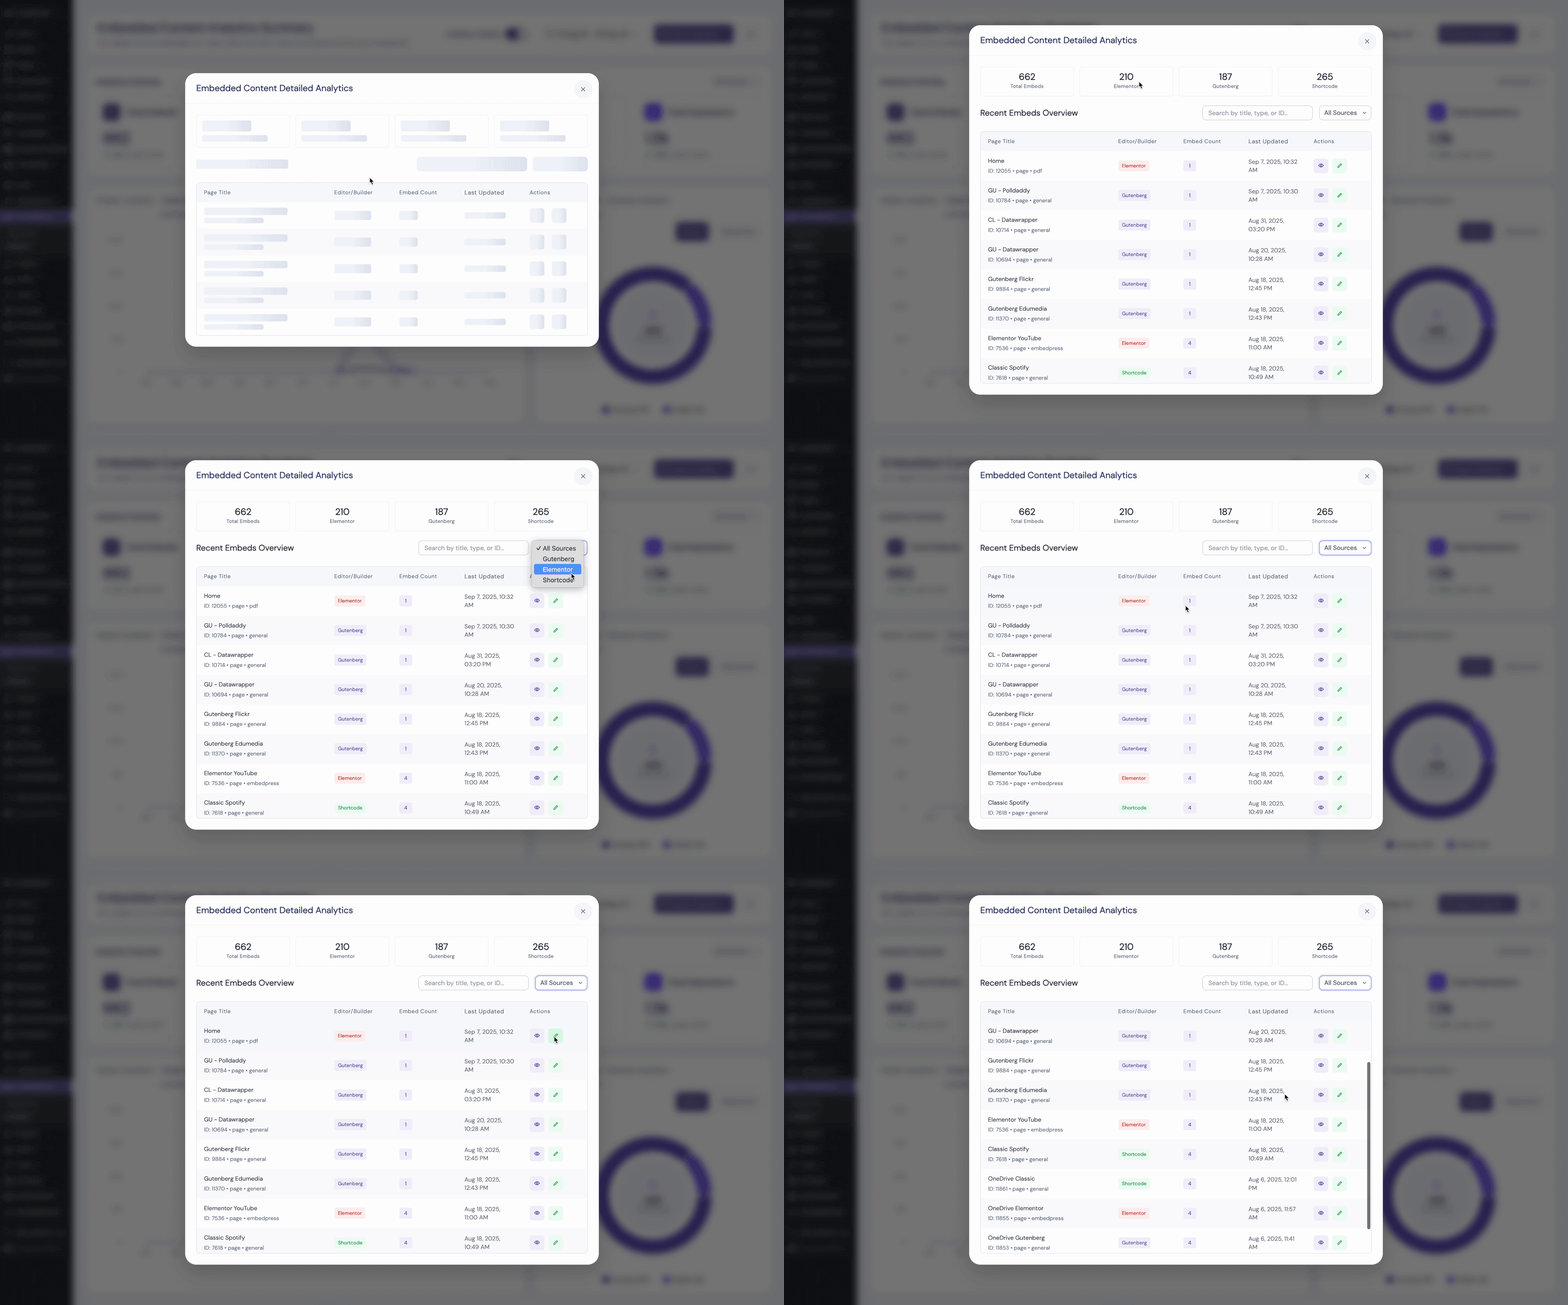
The Recent Embeds Overview table includes the Page Title and ID, the Editor/Builder, Embed Count, Last Updated, and quick actions to view or edit. Overall, it is like a drawer when you need to analyze embedded analytics for a specific page or to audit a set of posts after a content migration.
Viewer Locations #
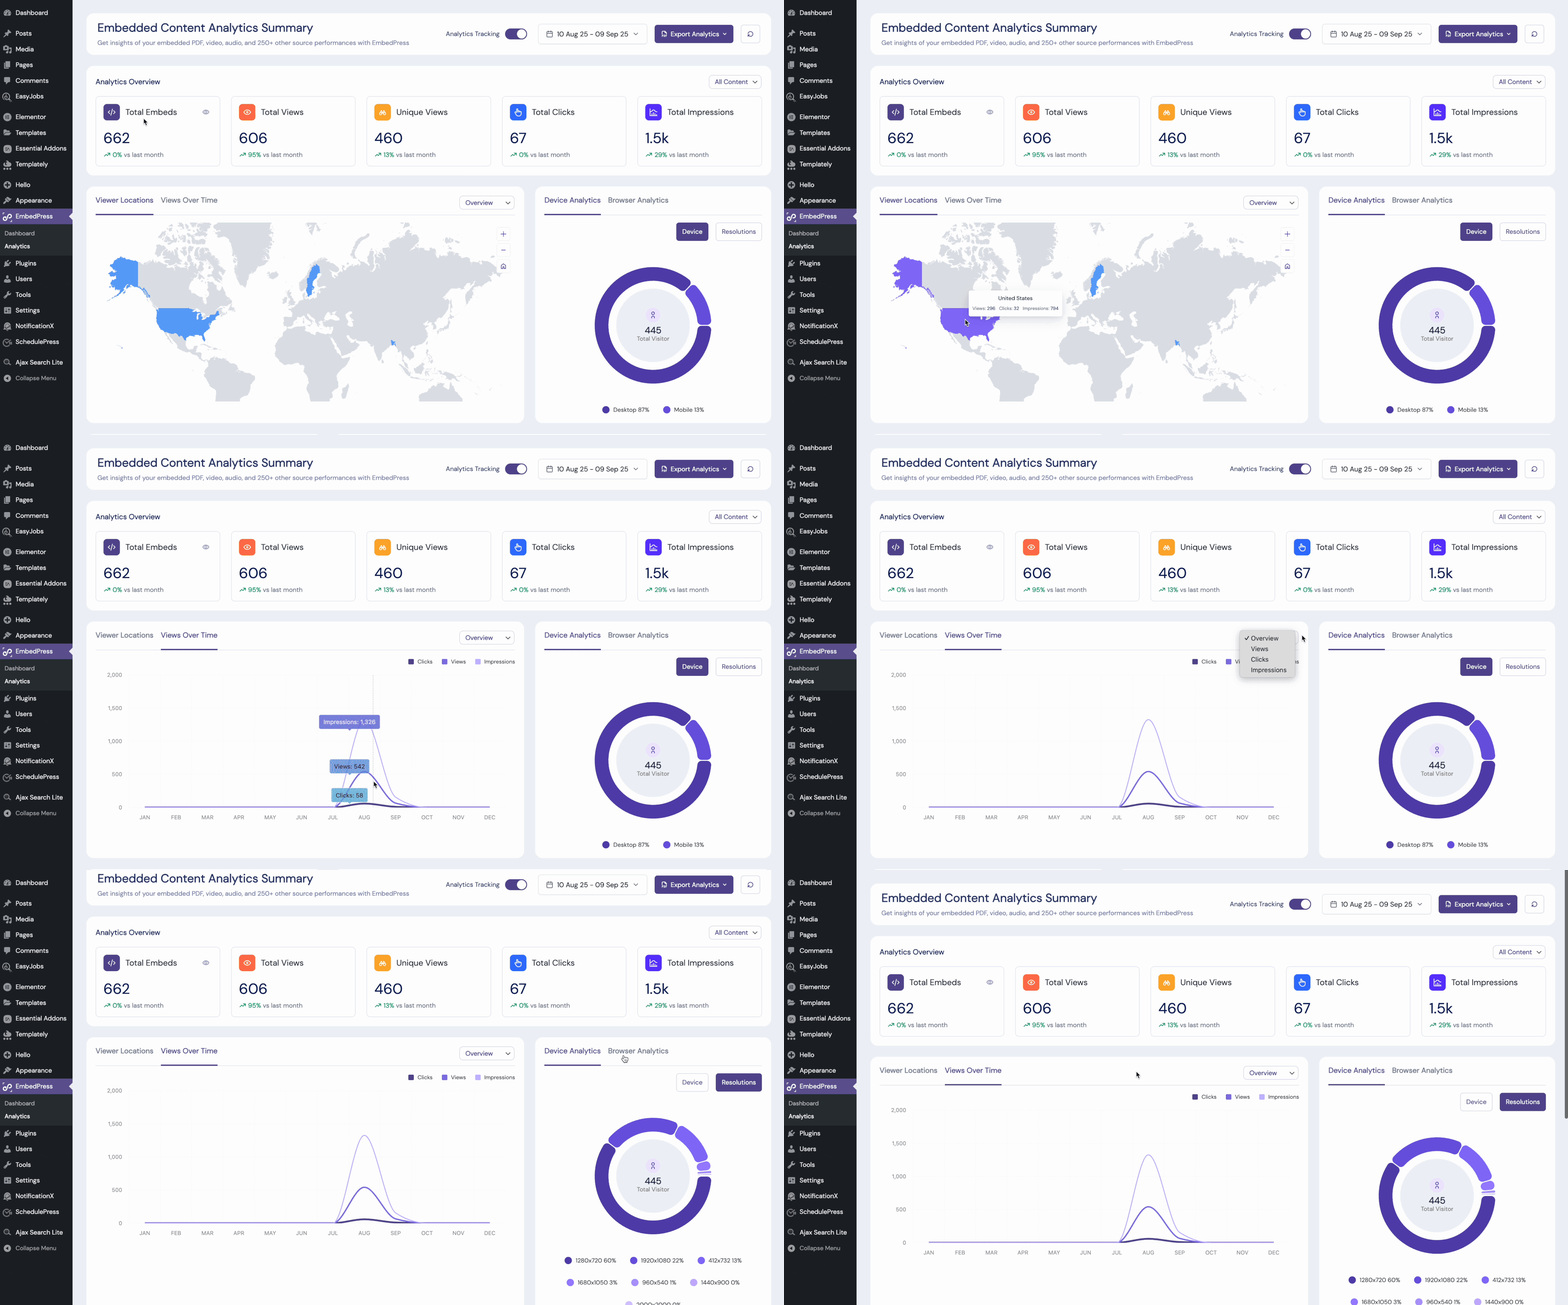
For getting audience insights, you will find two tabs with demographic and time-bound data. Here, ‘Viewer Locations’ displays a world map with per-country views, clicks, and impressions on hover.
Views Over Time #
The ‘Views Over Time’ shows the same data on a graphical format for a timeline (month or year). You can analyze embedded analytics here to discover where content resonates, then decide whether to localize, translate, or promote regionally.
Device Analytics #
Device & Browser Analytics reveals how visitors access your embeds. Start on Devices to see the desktop vs. mobile share. On the Resolutions tab, you can see the screen sizes of the devices used to browse your embeds.
Browser Analytics #
Switch tabs to Browser Analytics to learn about operating systems used or detailed device types to validate compatibility and prioritize your responsive actions on your embeds.
UTM Traffic Source #
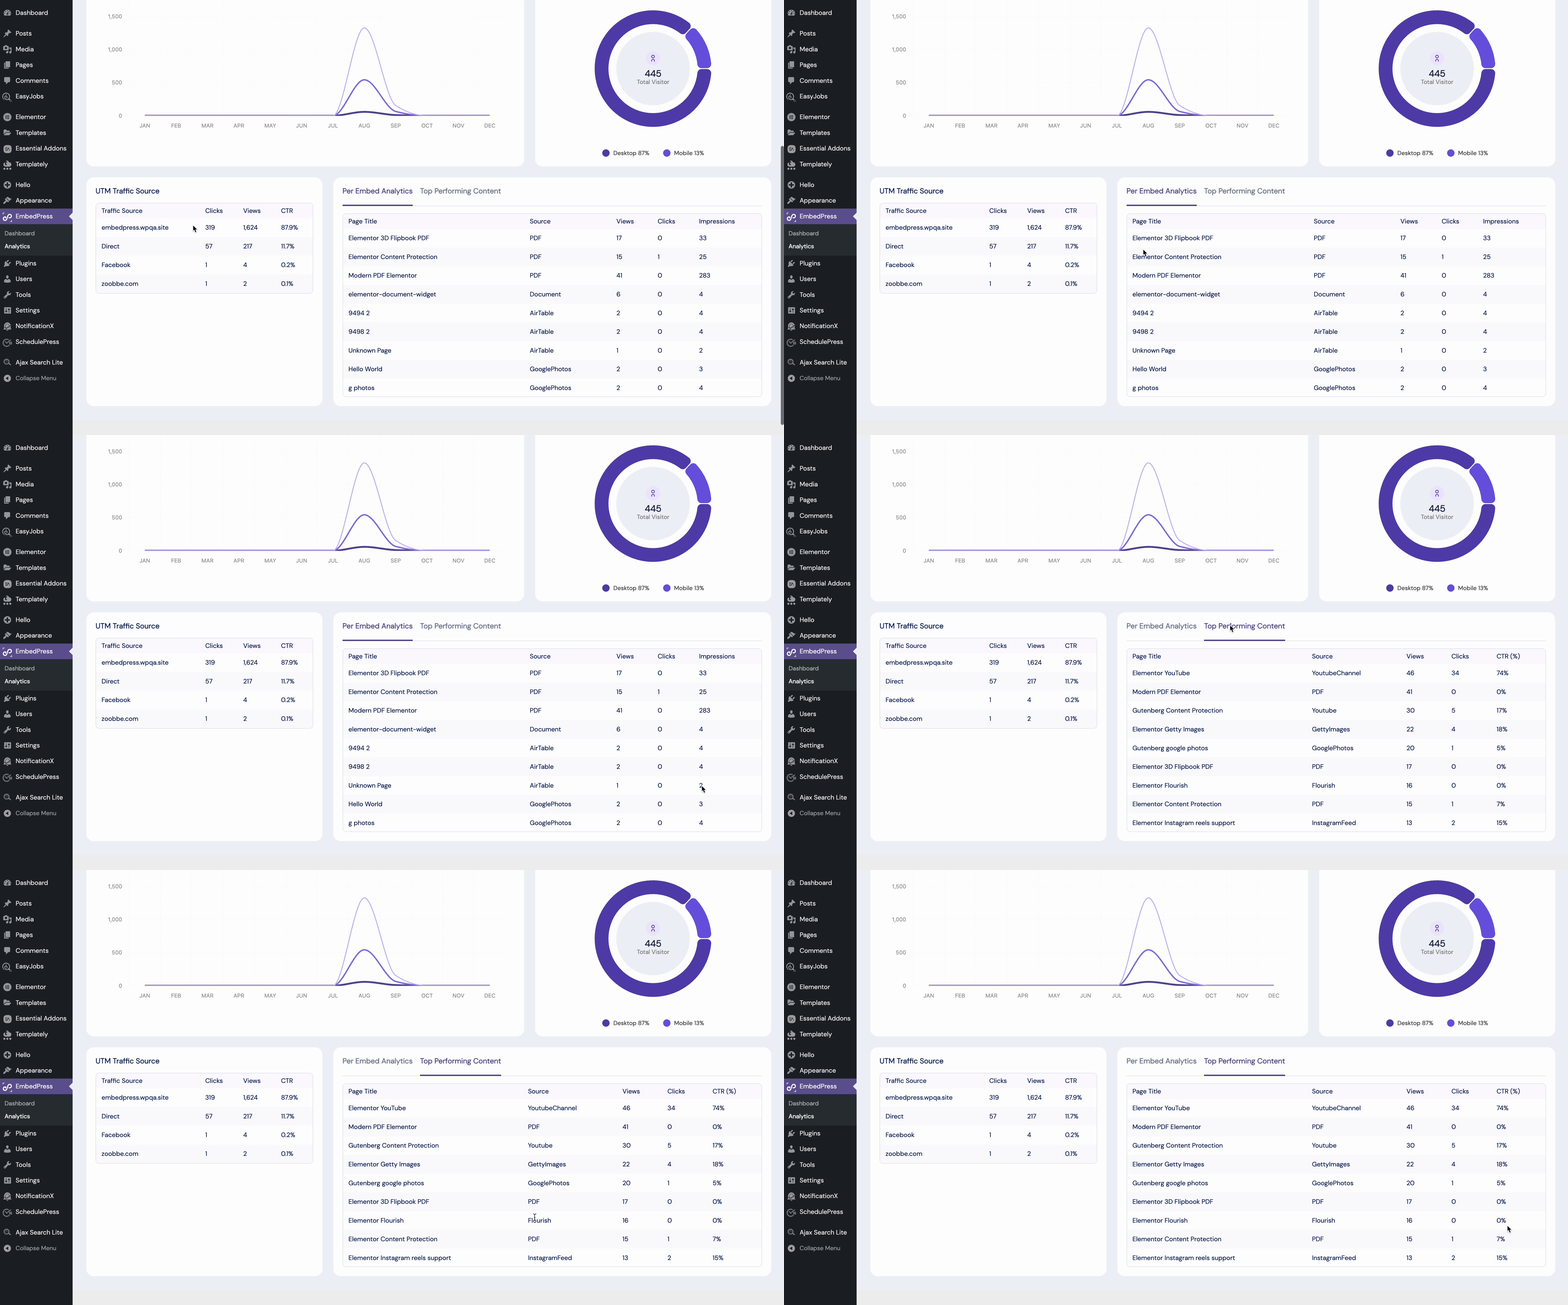
The UTM Traffic Source section shows where visitors are coming from and how they interact with your embedded content. It lists traffic sources such as direct visits, social media (e.g., Facebook), or specific domains, along with key metrics like clicks, views, and click-through rate (CTR).
Per Embed Analytics #
Per Embed Analytics lists every page that contains an embed, along with Source (PDF, YouTube, Google Photos, etc.), Views, Clicks, and CTR (%). You can sort by CTR to find high-quality placements, or sort by views to see where your reach is concentrated.
Performance by Content #
Top-performing content tab surfaces winners automatically so you can replicate what works – content type, placement, and even the editor you used.
Step 3: Filters Analytics Data Based on Dates, Page Builders, etc. #
After the data is generated, you will notice the date range picker at the top-right lets you move between “Today,” “Yesterday,” “Last week,” “Last month,” and “Last quarter.” You can also set a custom timing window if you are comparing seasonal peaks.
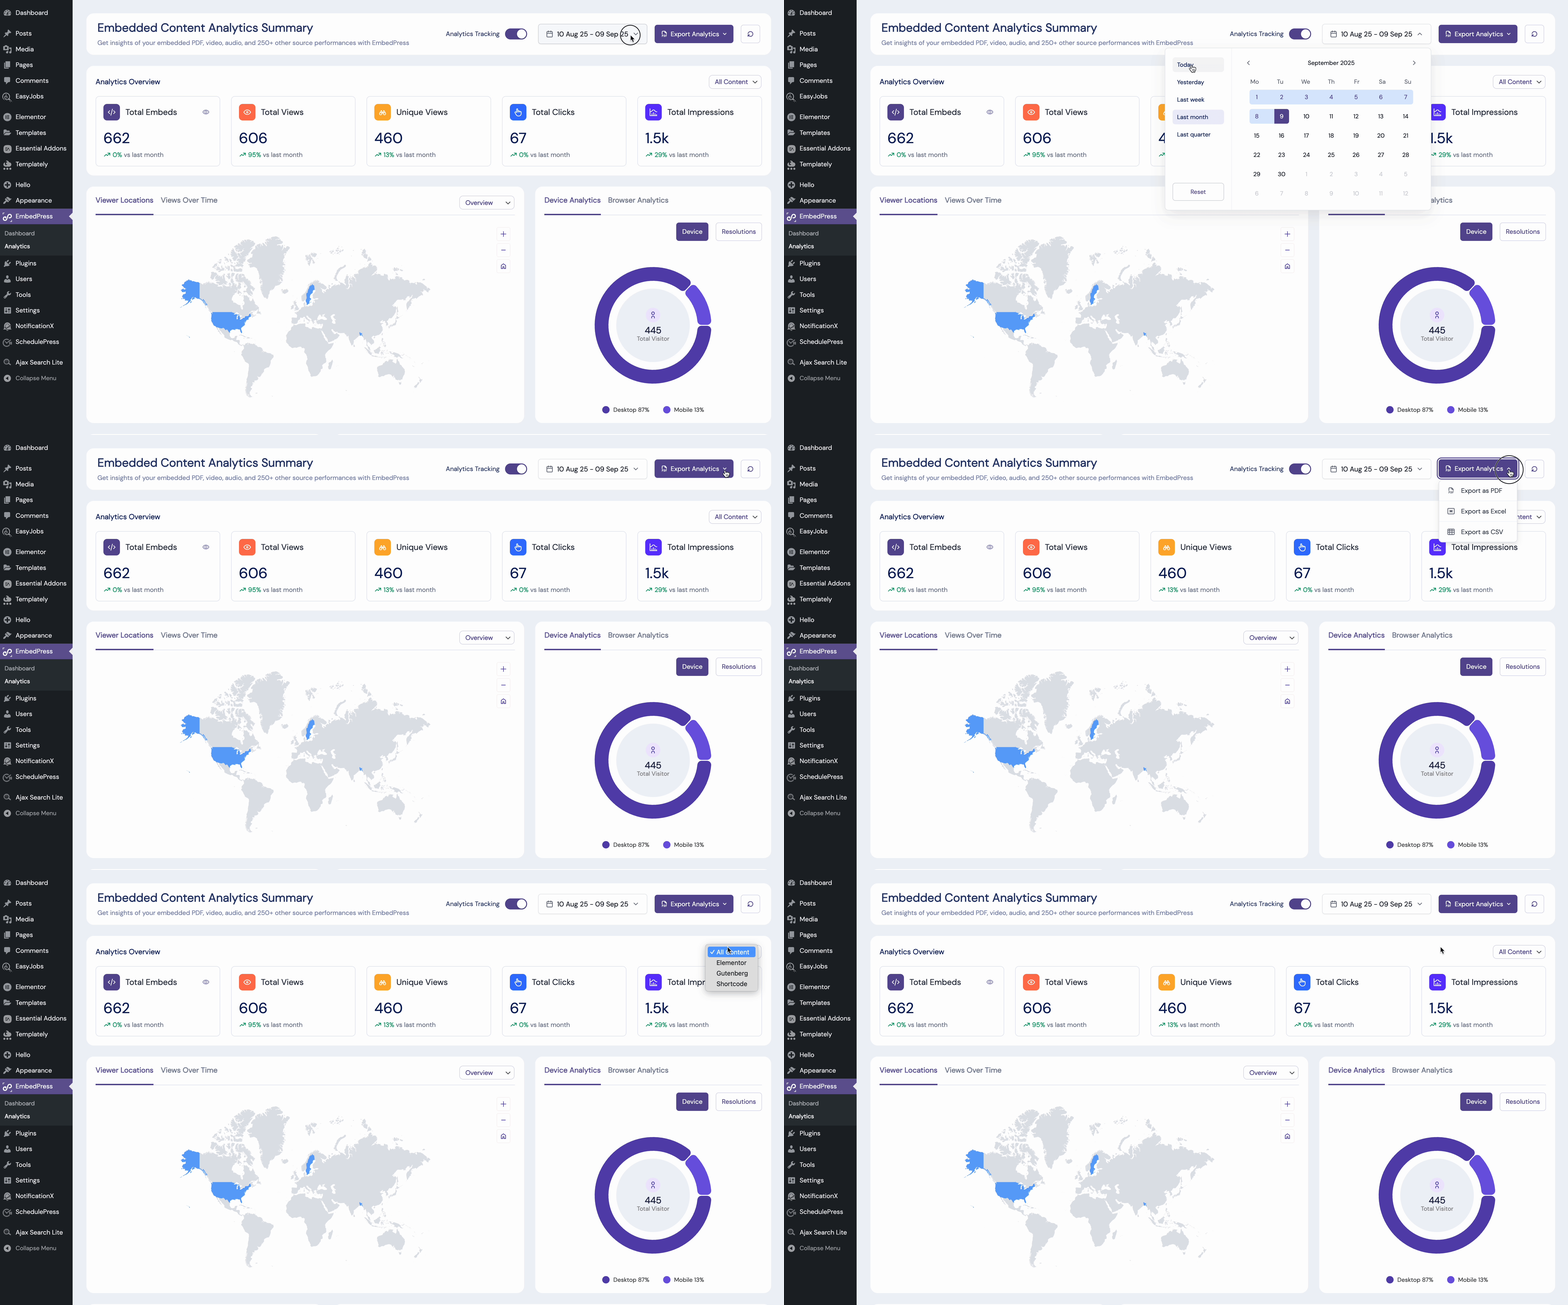
There is also a Reset option to clear filters quickly. You can use the Content Source filter right below it to scope reports to All Content, Elementor, Gutenberg, or Shortcode (for any other page builder).
Step 4: Export Analytical Data & Reporting #
Once you are done with analyzing your embedded content, you can export your entire analytics data. The Export Analytics menu lets you export files in PDF, Excel or CSV format. Teams often export monthly site-wide data and a second, builder-specific report to analyze embedded analytics by ownership.

Here is how you can easily analyze embedded analytics in WordPress with EmbedPress.
If you face any problems and need further assistance, contact our Support Team or join our Facebook Community to connect with content creators and WordPress experts like yourself.


